Creates an interactive heatmap visualization of document similarity matrices with support for document metadata, feature-specific colorscales, and rich tooltips. Supports both symmetric (all-vs-all) and cross-category comparison modes.
Usage
plot_similarity_heatmap(
  similarity_matrix,
  docs_data = NULL,
  feature_type = "words",
  method_name = "Cosine",
  title = NULL,
  category_filter = NULL,
  doc_id_var = NULL,
  colorscale = NULL,
  height = 600,
  width = NULL,
  row_category = NULL,
  col_categories = NULL,
  category_var = "category_display",
  show_values = FALSE,
  facet = NULL,
  row_label = NULL,
  output_type = "plotly"
)
Arguments
- similarity_matrix
A square numeric matrix of similarity scores
- docs_data
Optional data frame with document metadata containing:
document_number: Document identifiers for axis labelsdocument_id_display: Document IDs for hover textcategory_display: Category labels for hover text
- feature_type
Feature space type: "words", "topics", "ngrams", or "embeddings" (determines colorscale and display name)
- method_name
Similarity method name for display (default: "Cosine")
- title
Plot title (default: NULL, auto-generated from feature_type)
- category_filter
Optional category filter label for title (default: NULL)
- doc_id_var
Name of document ID variable (affects label text, default: NULL)
- colorscale
Plotly colorscale override (default: NULL, uses feature_type default)
- height
Plot height in pixels (default: 600)
- width
Plot width in pixels (default: NULL for auto)
- row_category
Category for row documents in cross-category mode (default: NULL)
- col_categories
Character vector of categories for column documents (default: NULL)
- category_var
Name of category variable in docs_data (default: "category_display")
- show_values
Logical; show similarity values as text on tiles (default: FALSE)
- facet
Logical; facet by column categories (default: TRUE when col_categories specified)
- row_label
Label for row axis (default: NULL, uses row_category)
- output_type
Output type: "plotly" or "ggplot" (default: "plotly", auto-switches to "ggplot" for faceting)
Examples
# \donttest{
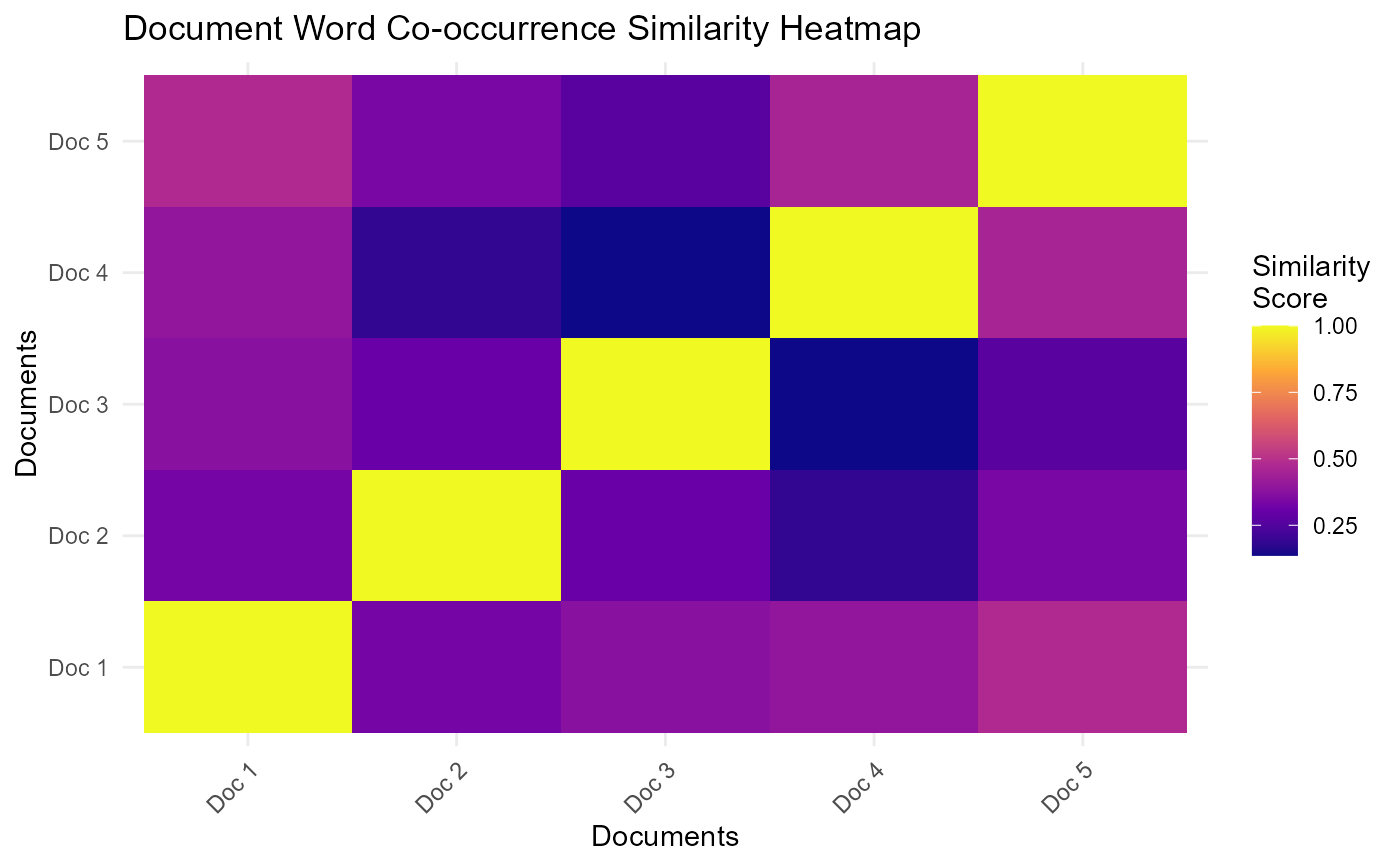
articles <- TextAnalysisR::SpecialEduTech[1:5, ]
term_matrix <- as.matrix(quanteda::dfm(quanteda::tokens(articles$abstract)))
normalized_matrix <- term_matrix / sqrt(rowSums(term_matrix ^ 2))
similarity_matrix <- normalized_matrix %*% t(normalized_matrix)
plot_similarity_heatmap(similarity_matrix)
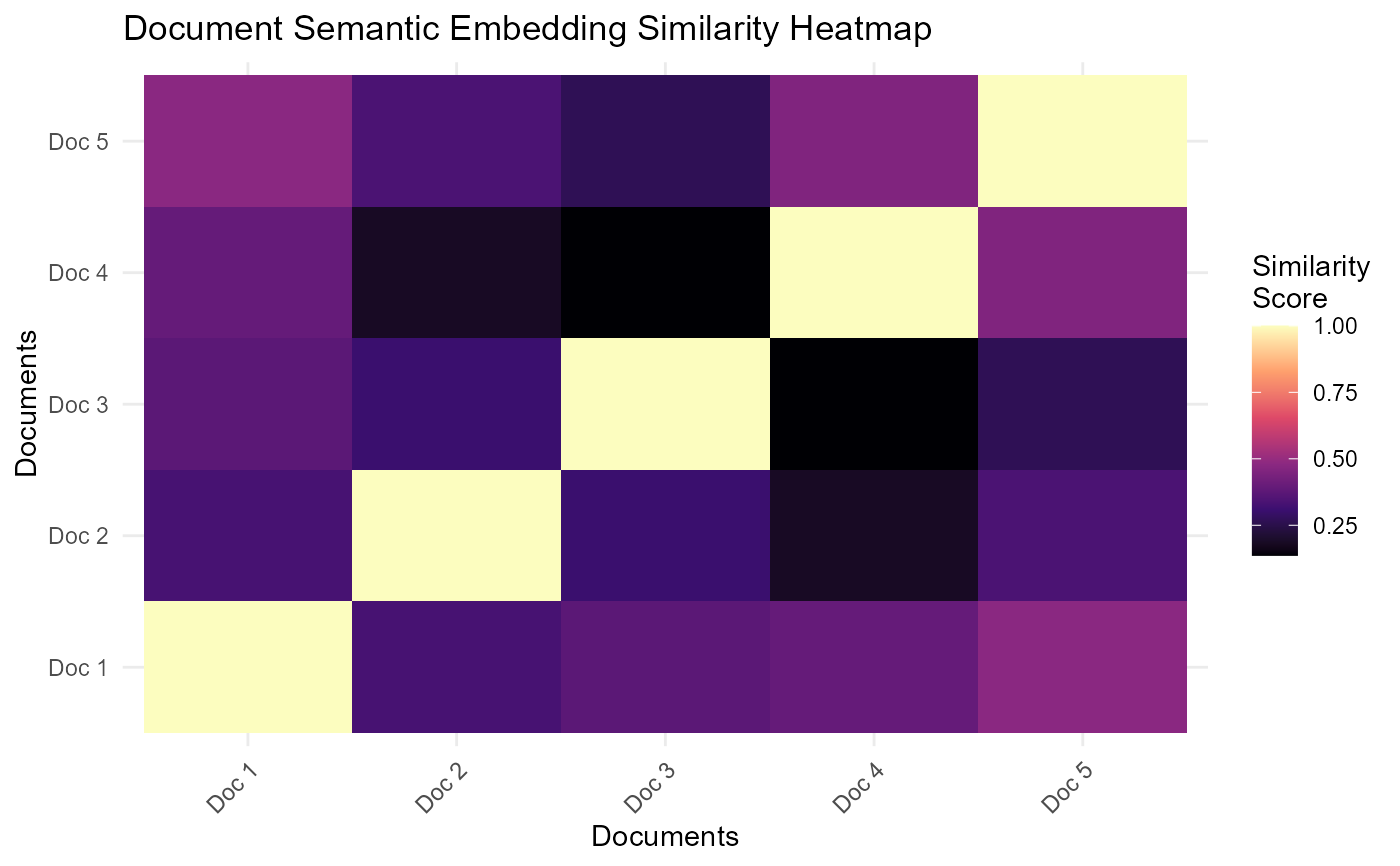
 document_metadata <- data.frame(
document_number = paste("Doc", 1:5),
document_id_display = articles$title,
category_display = articles$reference_type
)
plot_similarity_heatmap(similarity_matrix, docs_data = document_metadata,
feature_type = "embeddings")
document_metadata <- data.frame(
document_number = paste("Doc", 1:5),
document_id_display = articles$title,
category_display = articles$reference_type
)
plot_similarity_heatmap(similarity_matrix, docs_data = document_metadata,
feature_type = "embeddings")
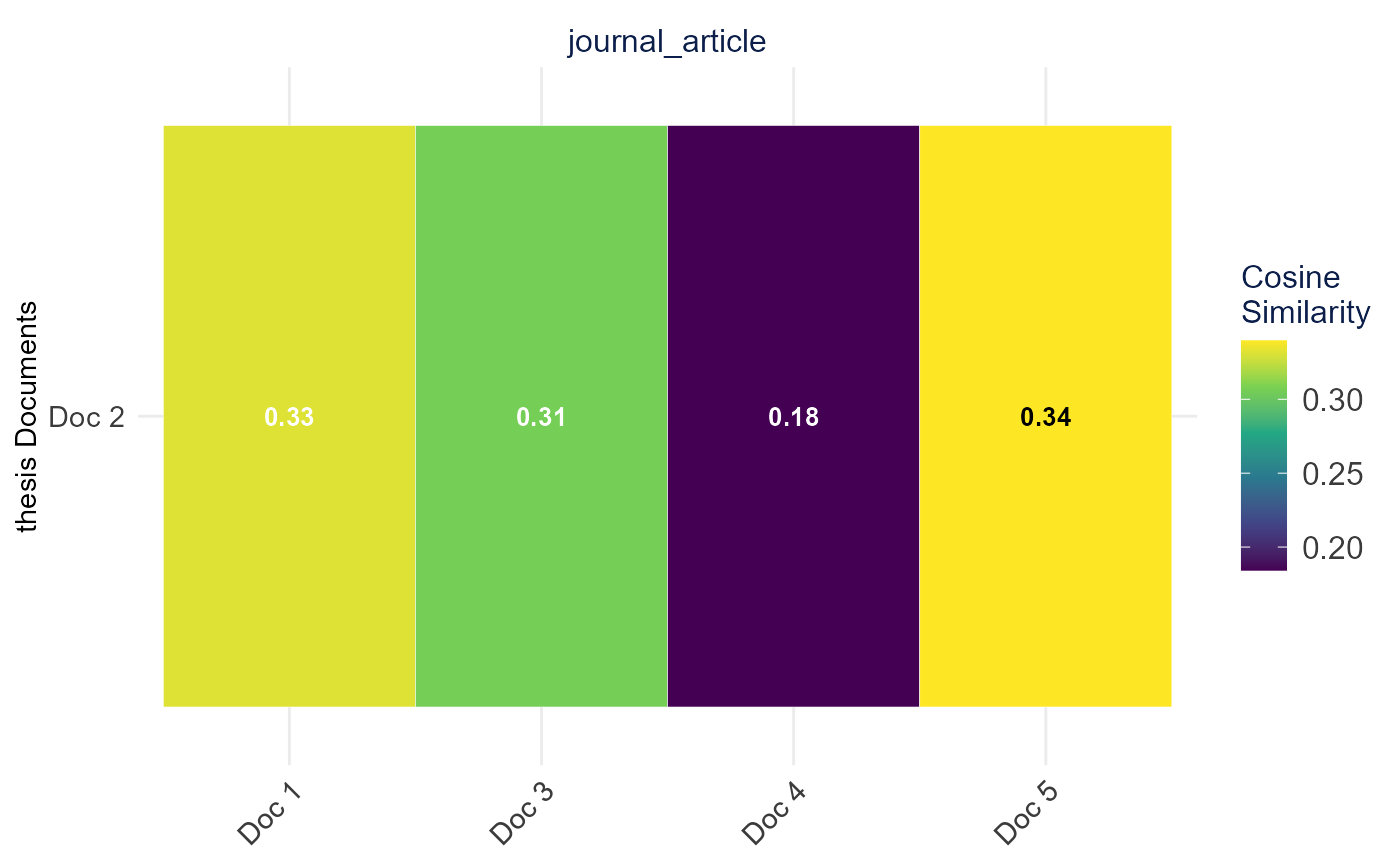
 plot_similarity_heatmap(
similarity_matrix,
docs_data = document_metadata,
row_category = "thesis",
col_categories = "journal_article",
show_values = TRUE,
facet = TRUE
)
plot_similarity_heatmap(
similarity_matrix,
docs_data = document_metadata,
row_category = "thesis",
col_categories = "journal_article",
show_values = TRUE,
facet = TRUE
)
 # }
# }