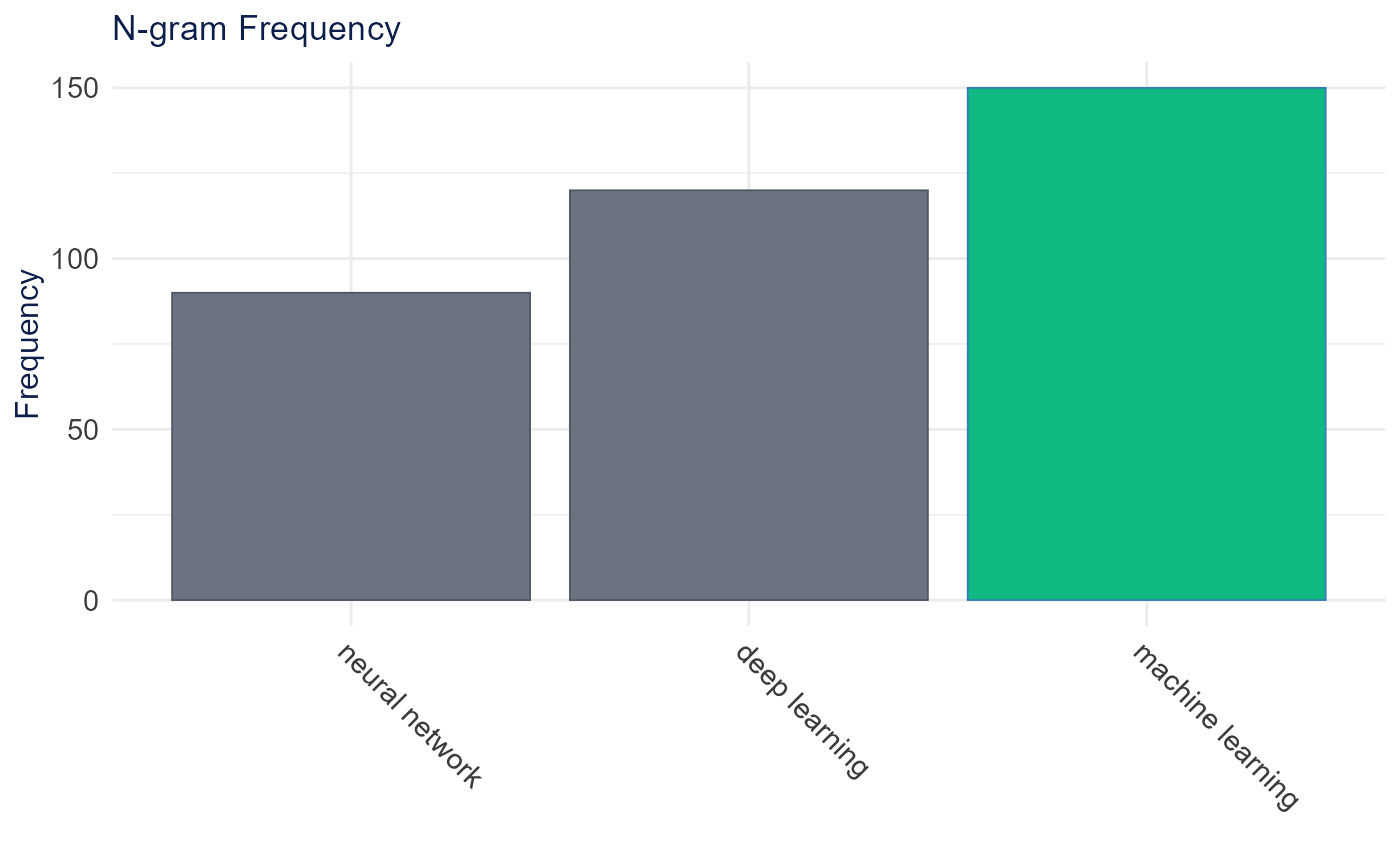
Creates a bar plot showing n-gram frequencies with optional highlighting of selected n-grams. Supports both detected n-grams and selected multi-word expressions.
Usage
plot_ngram_frequency(
  ngram_data,
  top_n = 30,
  selected = NULL,
  title = "N-gram Frequency",
  highlight_color = "#10B981",
  default_color = "#6B7280",
  height = 500,
  width = NULL,
  show_stats = TRUE
)
Arguments
- ngram_data
Data frame containing n-gram data with columns:
collocation: The n-gram textcount: Frequency countlambda: (optional) Lambda statisticz: (optional) Z-score statistic
- top_n
Number of top n-grams to display (default: 30)
- selected
Character vector of selected n-grams to highlight (default: NULL)
- title
Plot title (default: "N-gram Frequency")
- highlight_color
Color for highlighted bars (default: "#10B981")
- default_color
Color for non-highlighted bars (default: "#6B7280")
- height
Plot height in pixels (default: 500)
- width
Plot width in pixels (default: NULL for auto)
- show_stats
Whether to show lambda and z-score in hover (default: TRUE)