Plot Cross-Category Similarity Comparison
Source:R/semantic_analysis.R
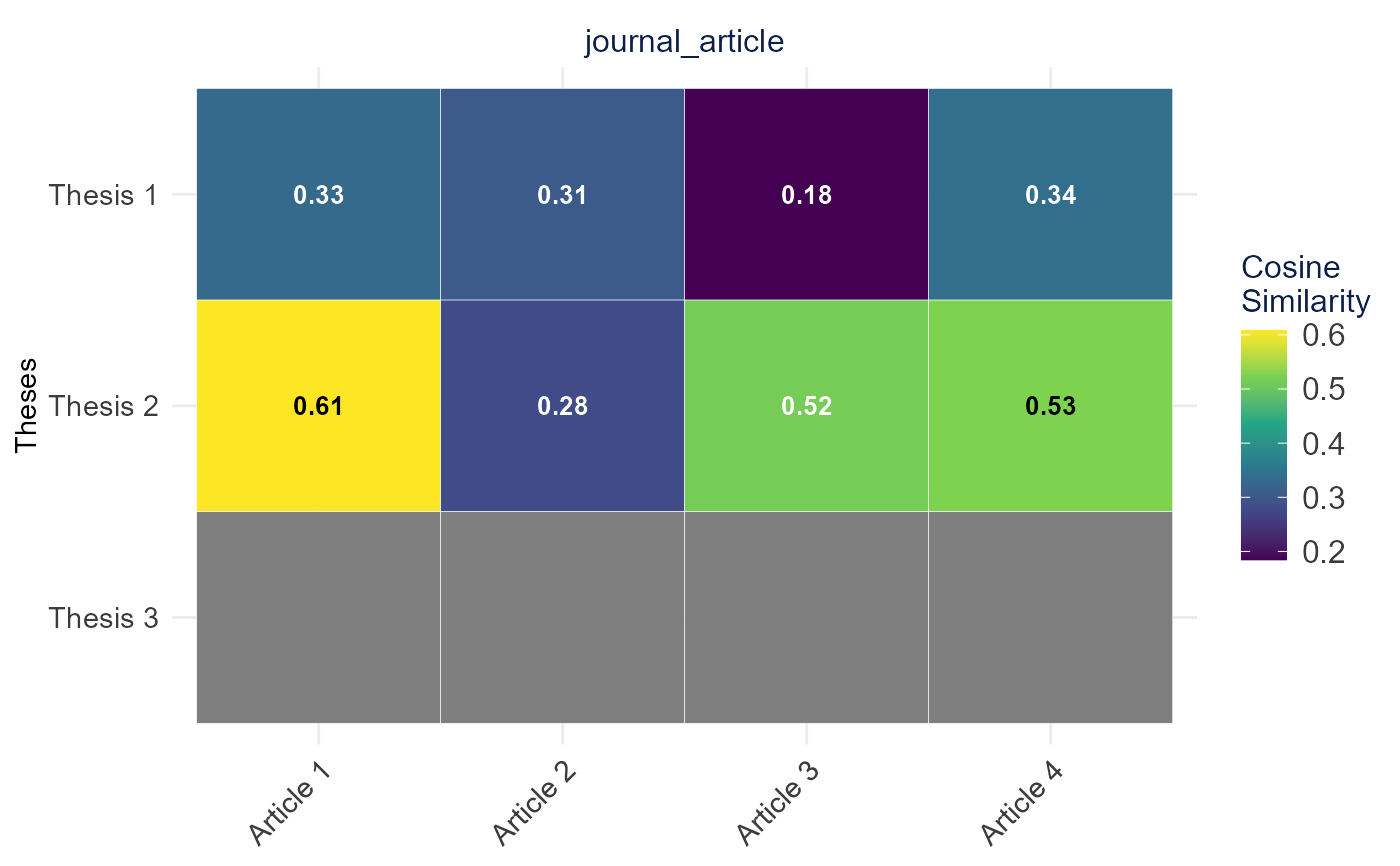
plot_cross_category_heatmap.RdCreates a faceted ggplot heatmap for cross-category document similarity comparison. Accepts either a pre-built long-format data frame or extracts from a similarity matrix.
Usage
plot_cross_category_heatmap(
  similarity_data,
  docs_data = NULL,
  row_var = "ld_doc_name",
  col_var = "other_doc_name",
  value_var = "cosine_similarity",
  category_var = "other_category",
  row_category = NULL,
  col_categories = NULL,
  row_display_var = NULL,
  col_display_var = NULL,
  method_name = "Cosine",
  title = NULL,
  show_values = TRUE,
  row_label = "Documents",
  label_max_chars = 25,
  order_by_numeric = TRUE,
  height = 600,
  width = NULL
)
Arguments
- similarity_data
Either a similarity matrix (square numeric matrix) or a data frame in long format with columns for row labels, column labels, similarity values, and category.
- docs_data
Data frame with document metadata (required if similarity_data is a matrix)
- row_var
Column name for row document labels (default: "ld_doc_name")
- col_var
Column name for column document labels (default: "other_doc_name")
- value_var
Column name for similarity values (default: "cosine_similarity")
- category_var
Column name for category in long-format data or docs_data (default: "other_category")
- row_category
Category for row documents (used with matrix input)
- col_categories
Categories for column documents (used with matrix input)
- row_display_var
Column name for row display labels in tooltip (default: NULL, uses row_var)
- col_display_var
Column name for column display labels in tooltip (default: NULL, uses col_var)
- method_name
Similarity method name for legend (default: "Cosine")
- title
Plot title (default: NULL)
- show_values
Logical; show similarity values as text on tiles (default: TRUE)
- row_label
Label for y-axis (default: "Documents")
- label_max_chars
Maximum characters for axis labels before truncation (default: 25)
- order_by_numeric
Logical; order by numeric ID extracted from labels (default: TRUE)
- height
Plot height (default: 600)
- width
Plot width (default: NULL)
Examples
# \donttest{
articles <- TextAnalysisR::SpecialEduTech[1:7, ]
term_matrix <- as.matrix(quanteda::dfm(quanteda::tokens(articles$abstract)))
normalized_matrix <- term_matrix / sqrt(rowSums(term_matrix ^ 2))
similarity_matrix <- normalized_matrix %*% t(normalized_matrix)
thesis_rows <- which(articles$reference_type == "thesis")[1:3]
article_cols <- which(articles$reference_type == "journal_article")[1:4]
similarity_data <- expand.grid(
  ld_doc_name    = paste("Thesis", seq_along(thesis_rows)),
  other_doc_name = paste("Article", seq_along(article_cols)),
  stringsAsFactors = FALSE
)
similarity_data$cosine_similarity <- as.vector(
  similarity_matrix[thesis_rows, article_cols]
)
similarity_data$other_category <- articles$reference_type[article_cols]
plot_cross_category_heatmap(
  similarity_data = similarity_data,
  row_var = "ld_doc_name",
  col_var = "other_doc_name",
  value_var = "cosine_similarity",
  category_var = "other_category",
  row_label = "Theses"
)
#> Warning: Removed 4 rows containing missing values or values outside the scale range
#> (`geom_text()`).

# }
# }