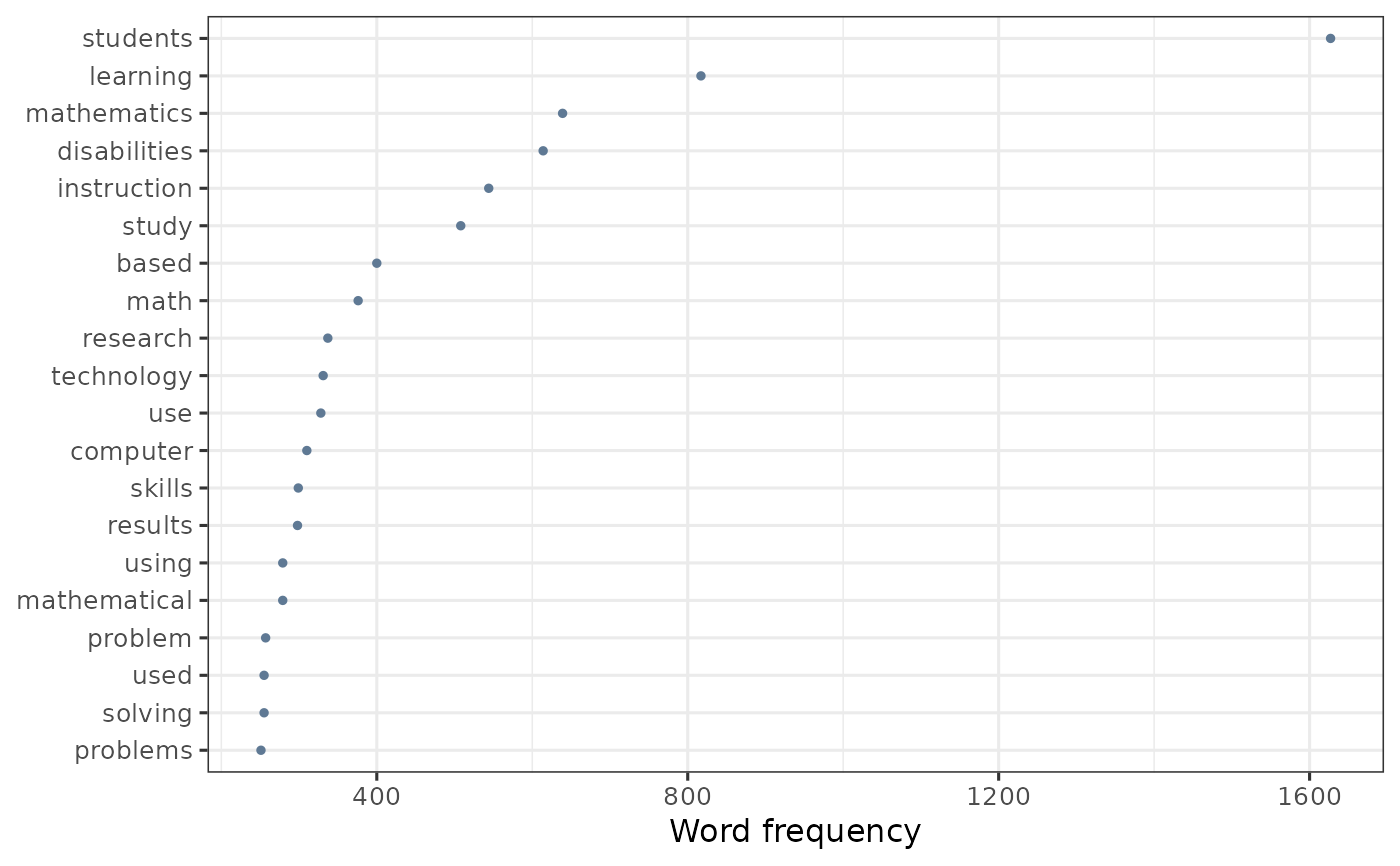
Creates a bar plot showing the most frequent words in a document-feature matrix (dfm).
Arguments
- dfm_object
A document-feature matrix created by quanteda::dfm().
- n
The number of top words to display (default: 20).
- height
Plot height in pixels (default: 800). Kept for backward compatibility.
- width
Plot width in pixels (default: 1000). Kept for backward compatibility.
- ...
Additional arguments (kept for backward compatibility).