Creates interactive visualizations for semantic analysis results including similarity heatmaps, dimensionality reduction plots, and clustering visualizations.
Usage
plot_semantic_viz(
  analysis_result = NULL,
  plot_type = "similarity",
  data_labels = NULL,
  color_by = NULL,
  height = 600,
  width = 800,
  title = NULL,
  coords = NULL,
  clusters = NULL,
  hover_text = NULL,
  hover_config = NULL,
  cluster_colors = NULL
)
Arguments
- analysis_result
A list containing semantic analysis results from functions like semantic_similarity_analysis(), semantic_document_clustering(), or reduce_dimensions().
- plot_type
Type of visualization: "similarity" for heatmap, "dimensionality_reduction" for scatter plot, or "clustering" for cluster visualization (default: "similarity").
- data_labels
Optional character vector of labels for data points (default: NULL).
- color_by
Optional variable to color points by in scatter plots (default: NULL).
- height
The height of the resulting Plotly plot, in pixels (default: 600).
- width
The width of the resulting Plotly plot, in pixels (default: 800).
- title
Optional custom title for the plot (default: NULL).
- coords
Optional pre-computed coordinates for dimensionality reduction plots (default: NULL).
- clusters
Optional cluster assignments vector (default: NULL).
- hover_text
Optional custom hover text for points (default: NULL).
- hover_config
Optional hover configuration list (default: NULL).
- cluster_colors
Optional color palette for clusters (default: NULL).
Examples
# \donttest{
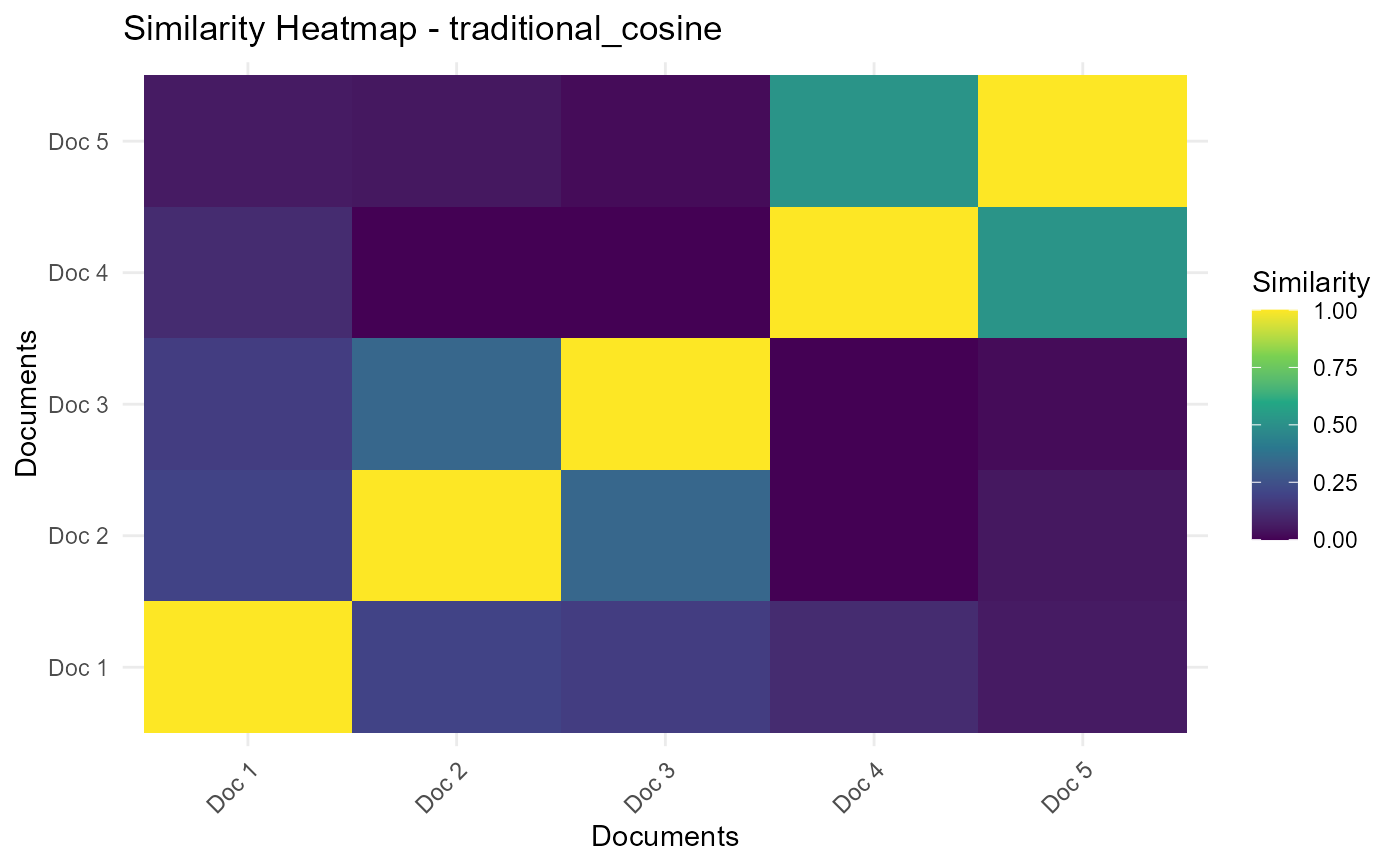
data(SpecialEduTech)
texts <- SpecialEduTech$abstract[1:5]
result <- semantic_similarity_analysis(texts)
#> Starting document similarity analysis...
#> Feature type: words
#> Similarity method: cosine
#> Use embeddings: FALSE
#> Step 1: Generating feature matrix...
#> Using word-based features...
#> Step 2: Calculating similarity matrix...
#> Step 3: Calculating metrics...
#> Document similarity analysis completed in 0.22 seconds
#> Documents analyzed: 5
#> Feature dimensions: 30
plot <- plot_semantic_viz(result, plot_type = "similarity")
print(plot)
 # }
# }