Plot Lexical Diversity Distribution
Source:R/lexical_analysis.R
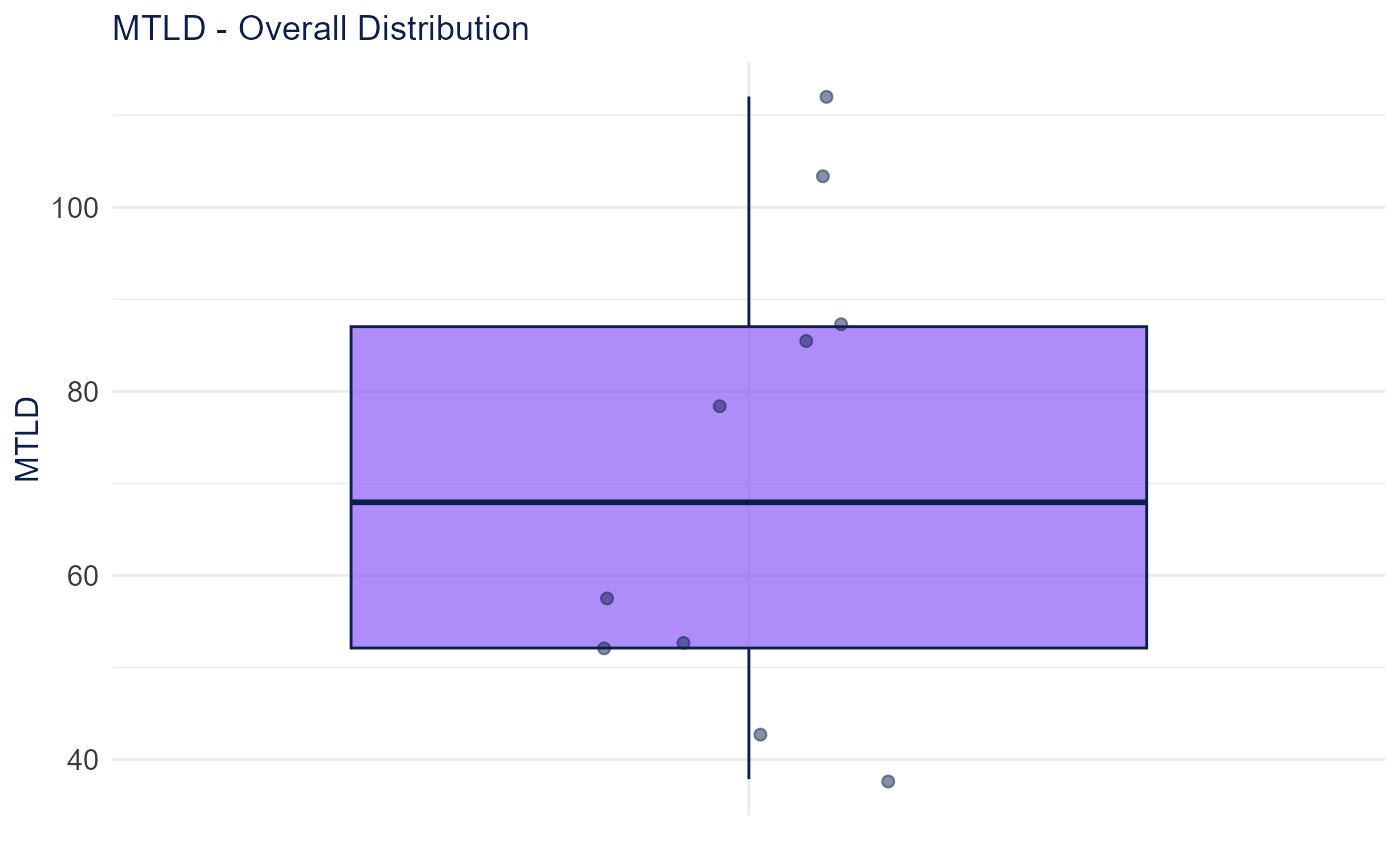
plot_lexical_diversity_distribution.RdCreates a boxplot showing the distribution of a lexical diversity metric.
Examples
# \donttest{
abstracts <- TextAnalysisR::SpecialEduTech$abstract[1:10]
tokens <- quanteda::tokens(quanteda::corpus(abstracts))
diversity_result <- lexical_diversity_analysis(tokens, texts = abstracts)
diversity_plot <- plot_lexical_diversity_distribution(
  diversity_result$lexical_diversity, "MTLD"
)
print(diversity_plot)

# }
# }