Analyze and Visualize Word Frequencies Across a Continuous Variable
Source:R/utils.R
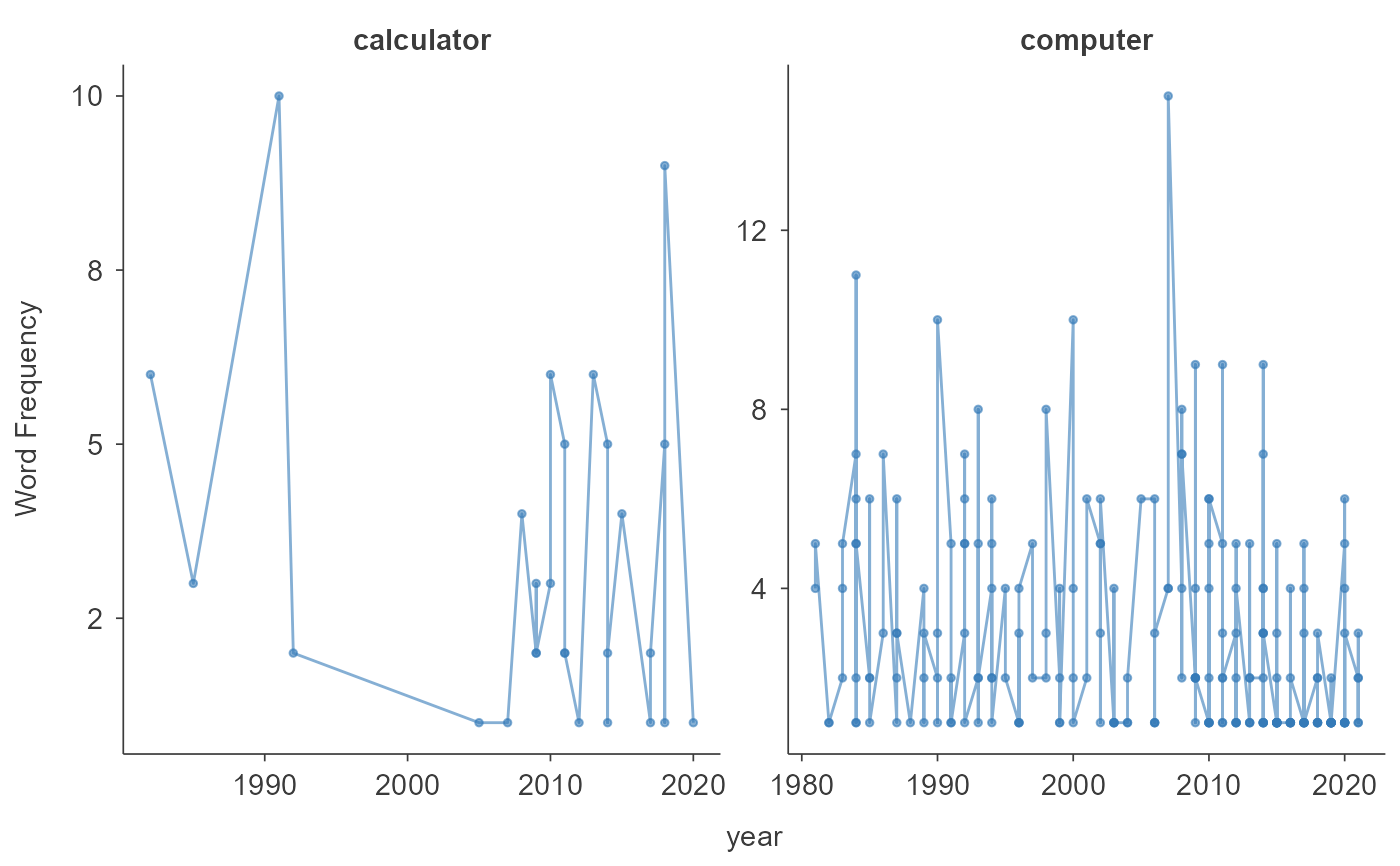
calculate_word_frequency.RdThis function analyzes and visualizes word frequencies across a continuous variable.
Usage
calculate_word_frequency(
  dfm_object,
  continuous_variable,
  selected_terms,
  height = 500,
  width = 900
)
Arguments
- dfm_object
A quanteda document-feature matrix (dfm).
- continuous_variable
A continuous variable in the metadata.
- selected_terms
A vector of terms to analyze trends for.
- height
The height of the resulting Plotly plot, in pixels (default: 500).
- width
The width of the resulting Plotly plot, in pixels (default: 900).
Details
This function requires a fitted STM model object and a quanteda dfm object. The continuous variable should be a column in the metadata of the dfm object. The selected terms should be a vector of terms to analyze trends for. The required packages are 'htmltools', 'splines', and 'broom' (plus additional ones loaded internally).
See also
extract_keywords_tfidf() and extract_keywords_keyness() for ranking terms by importance; plot_word_frequency() for the standard frequency-by-doc plot
Examples
# \donttest{
  mydata <- TextAnalysisR::SpecialEduTech

  united_tbl <- TextAnalysisR::unite_cols(
    mydata,
    listed_vars = c("title", "keyword", "abstract")
  )

  tokens <- TextAnalysisR::prep_texts(united_tbl, text_field = "united_texts")

  dfm_object <- quanteda::dfm(tokens)

  word_freq_results <- TextAnalysisR::calculate_word_frequency(
    dfm_object,
    continuous_variable = "year",
    selected_terms = c("calculator", "computer"),
    height = 500,
    width = 900
  )
#> Warning: NaNs produced
#> Warning: NaNs produced
  print(word_freq_results$plot)

  print(word_freq_results$table)
# }
print(word_freq_results$table)
# }