Agenda
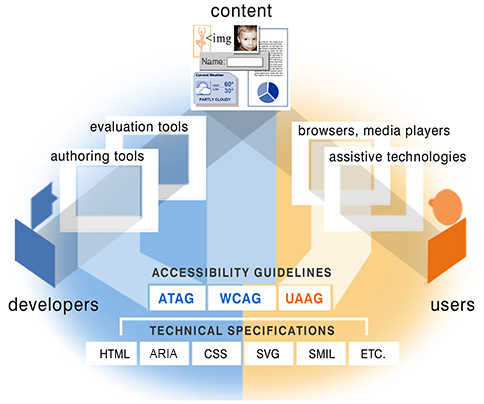
Math Wall: Using Visual Representations
What Are Virtual Manipulatives?
Examples and Benefits of Virtual Manipulatives
Resources for Selecting Educational Technology Tools
Case Study on Synchronous Online Instruction
Meta-Analysis: Three-Level Multilevel Modeling for Single-Case Data

Math Wall: Using Visual Representations
Source: Number Corner (Bridges Math)

What Are Virtual Manipulatives?
A dynamic visual model operational in environments like the web.
Initially developed through Flash or Java Applet programs in 1990s.
Adaptable in various forms for extension, transformation, and selection.
Can be employed for conceptual understanding in teaching and learning mathematics.
Offers interactive opportunities for diverse mathematical learning.
HTML5 was released in its public version in January 2008.
With the introduction of HTML5 web standards, became available on mobile devices.
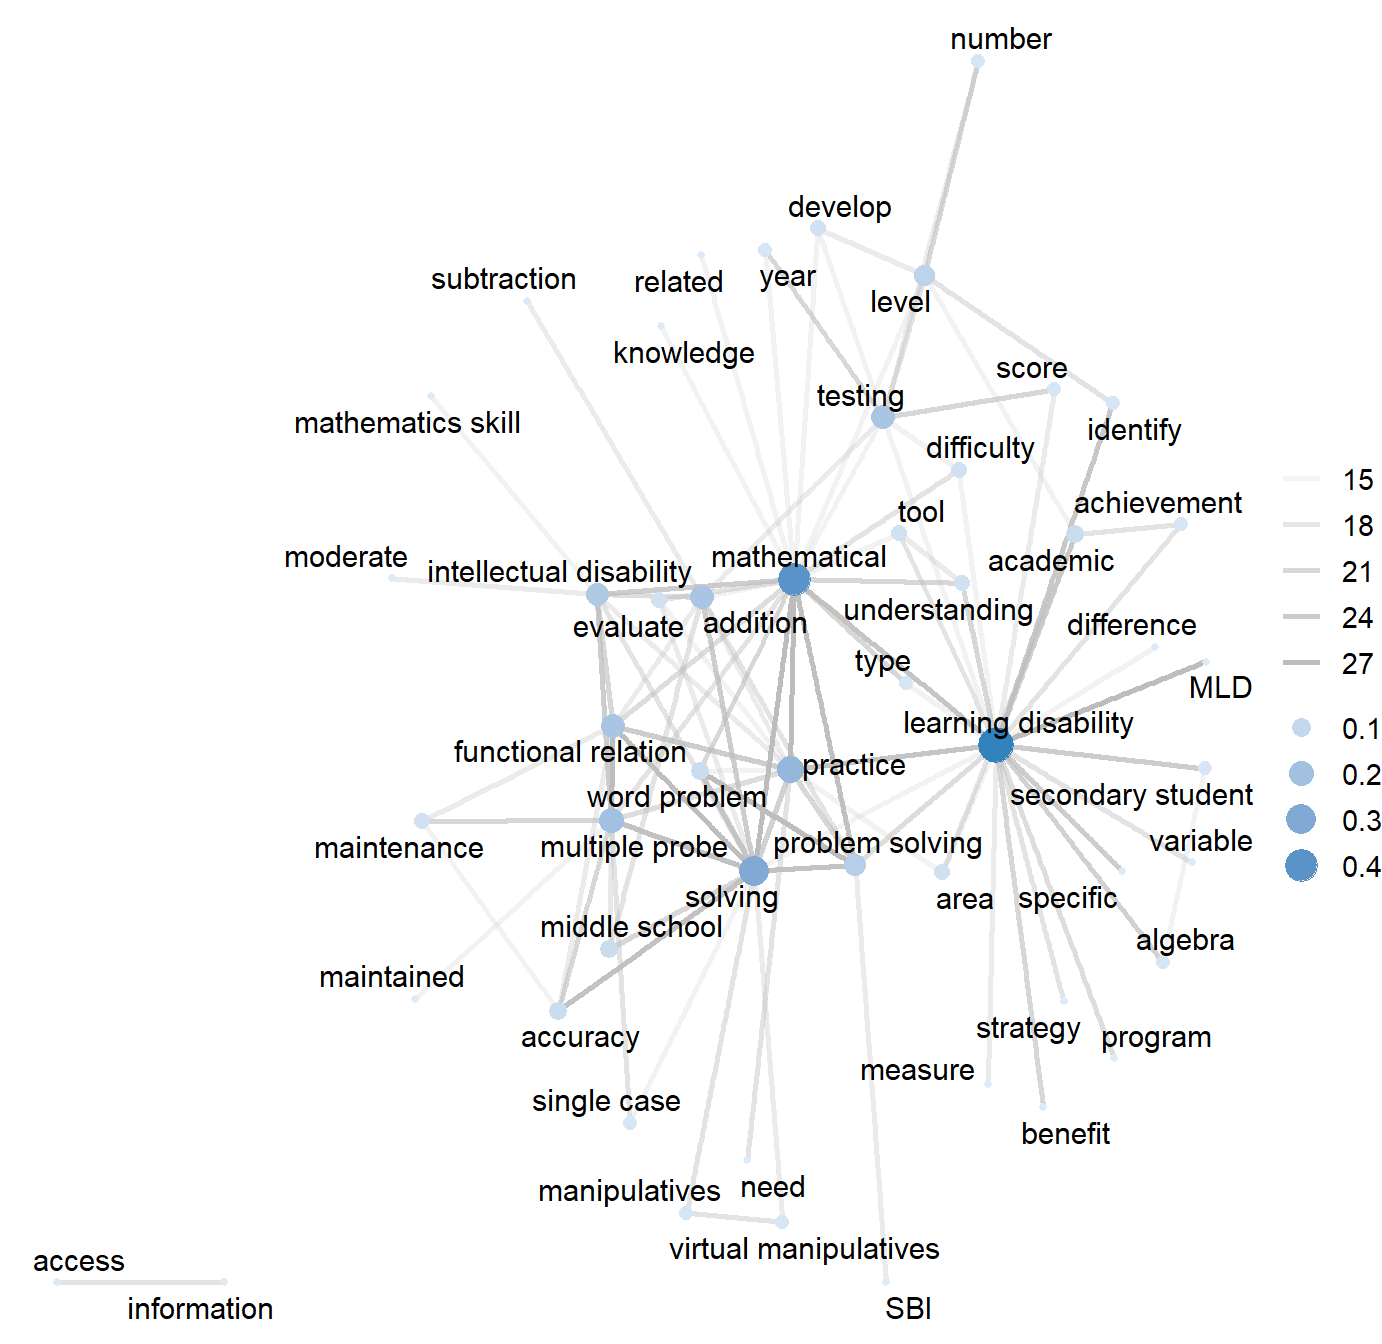
Word Networks Analysis
Source: Shin et al. (2023, p. 12)
- Since the 2010s, publications on the use of virtual manipulatives have increased.
- Incorporated within problem-solving instruction or an instructional sequence, such as virtual-representational-abstract (Bouck et al.,
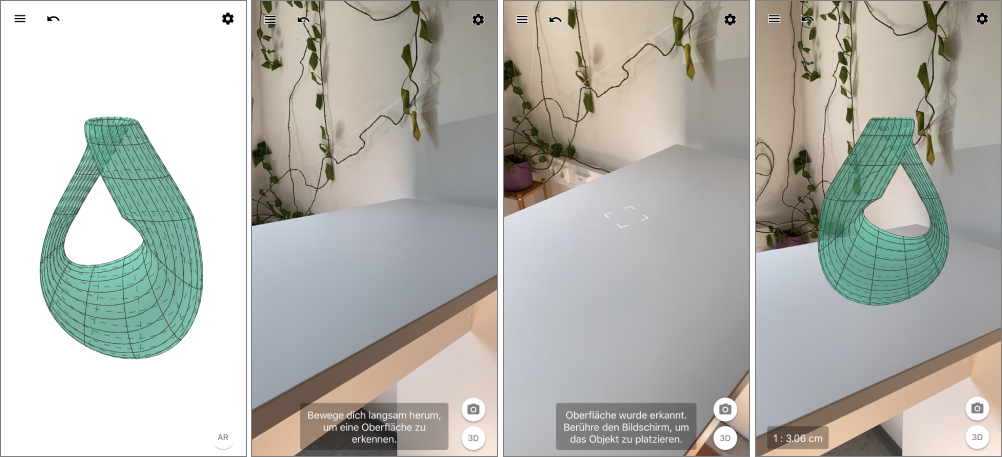
Examples of Virtual Manipulatives
Source: Shin et al. (2023, p. 201)

Benefits of Virtual Manipulatives
- Content-specific visual models for targeted mathematics concepts and skills
- Feedback for students to facilitate memory retention
- Free and ready-to-use online materials
- Multiple opportunities for practice
- Integration with other online tools (e.g., digital games, augmented reality, virtual reality)
Resources for Selecting Educational Technology Tools
Source: Common Sense Education

Case Study on Synchronous Online Instruction
Source: Park et al., (2023)

Three fifth-grade students with learning disabilities
Employing a multiple probe across participants single-case design
15 fraction lessons via video conferencing programs
Key Lesson Features and Results
- Lessons on Equivalent Fractions, Adapted from MSTAR Interventions (The University of Texas at Austin, 2011)
- Use of digital materials (i.e., virtual manipulatives, interactive whiteboard, and online assessments)
- Explicit instructions (i.e., lesson sequence of Introduction, Demonstration, Guided Practice, Independent Practice, and Closure)
- Students’ performance improved as the intervention was introduced; however, the extent and maintenance of improvement varied according to the students’ participation.
Park et al. (2023, p. 7)

Meta-Analysis: Three-Level Multilevel Modeling for Single-Case Data
Source: Shin et al. (2021)

35 studies published since 2000 on the effects of using virtual manipulatives for students with disabilities
Case-level variables: grade and disability
Study-level variables: pre-training purpose, Instructional method, type of virtual manipulative, Visual model
Multilevel Data Structure
Single-case design data are hierarchically structured and can be displayed using three-level multilevel modeling (Baek et al., 2022; Moeyaert et al., 2021; Pustejovsky & Ferron, 2017).
The levels examine repeated measurement occasions (Level 1) nested within cases (Level 2) and cases nested within studies (Level 3).
Applied a piecewise linear regression approach by separately modeling time trends in the baseline and intervention phases (Singer & Willett, 2003).

Conclusion and Future Directions
- The methodology for identifying evidence of interventions can vary based on research design and purpose.
- Visual analysis of graphical data is necessary to validate the functional relationship and intervention effects in the case study.
- Moderation effects can be further examined through meta-analysis of single-case design data or studies.
